
Monitoring
This tab has technical descriptions with data and information on the climate such as rainfall, temperature, wind etc. and how these combine to affect Drought situation. We seek to make the technical description accessible.
Contents
Drought Index
Standardized Precipitation Index (SPI) can be taken as an index, which can be used to identify whether there has been a drought in a certain time period.
SPI, based on probability of precipitation for any time scale, is calculated as :
SPI=(X-Xm) / σ
|
Where |
SPI Drought Classes:
|
Figure 1 shows the Standardized Precipitation Index (SPI) for the past three months of 2019. Generally Sri Lanka can be divided in to four main climate regions as North, East, West and South.
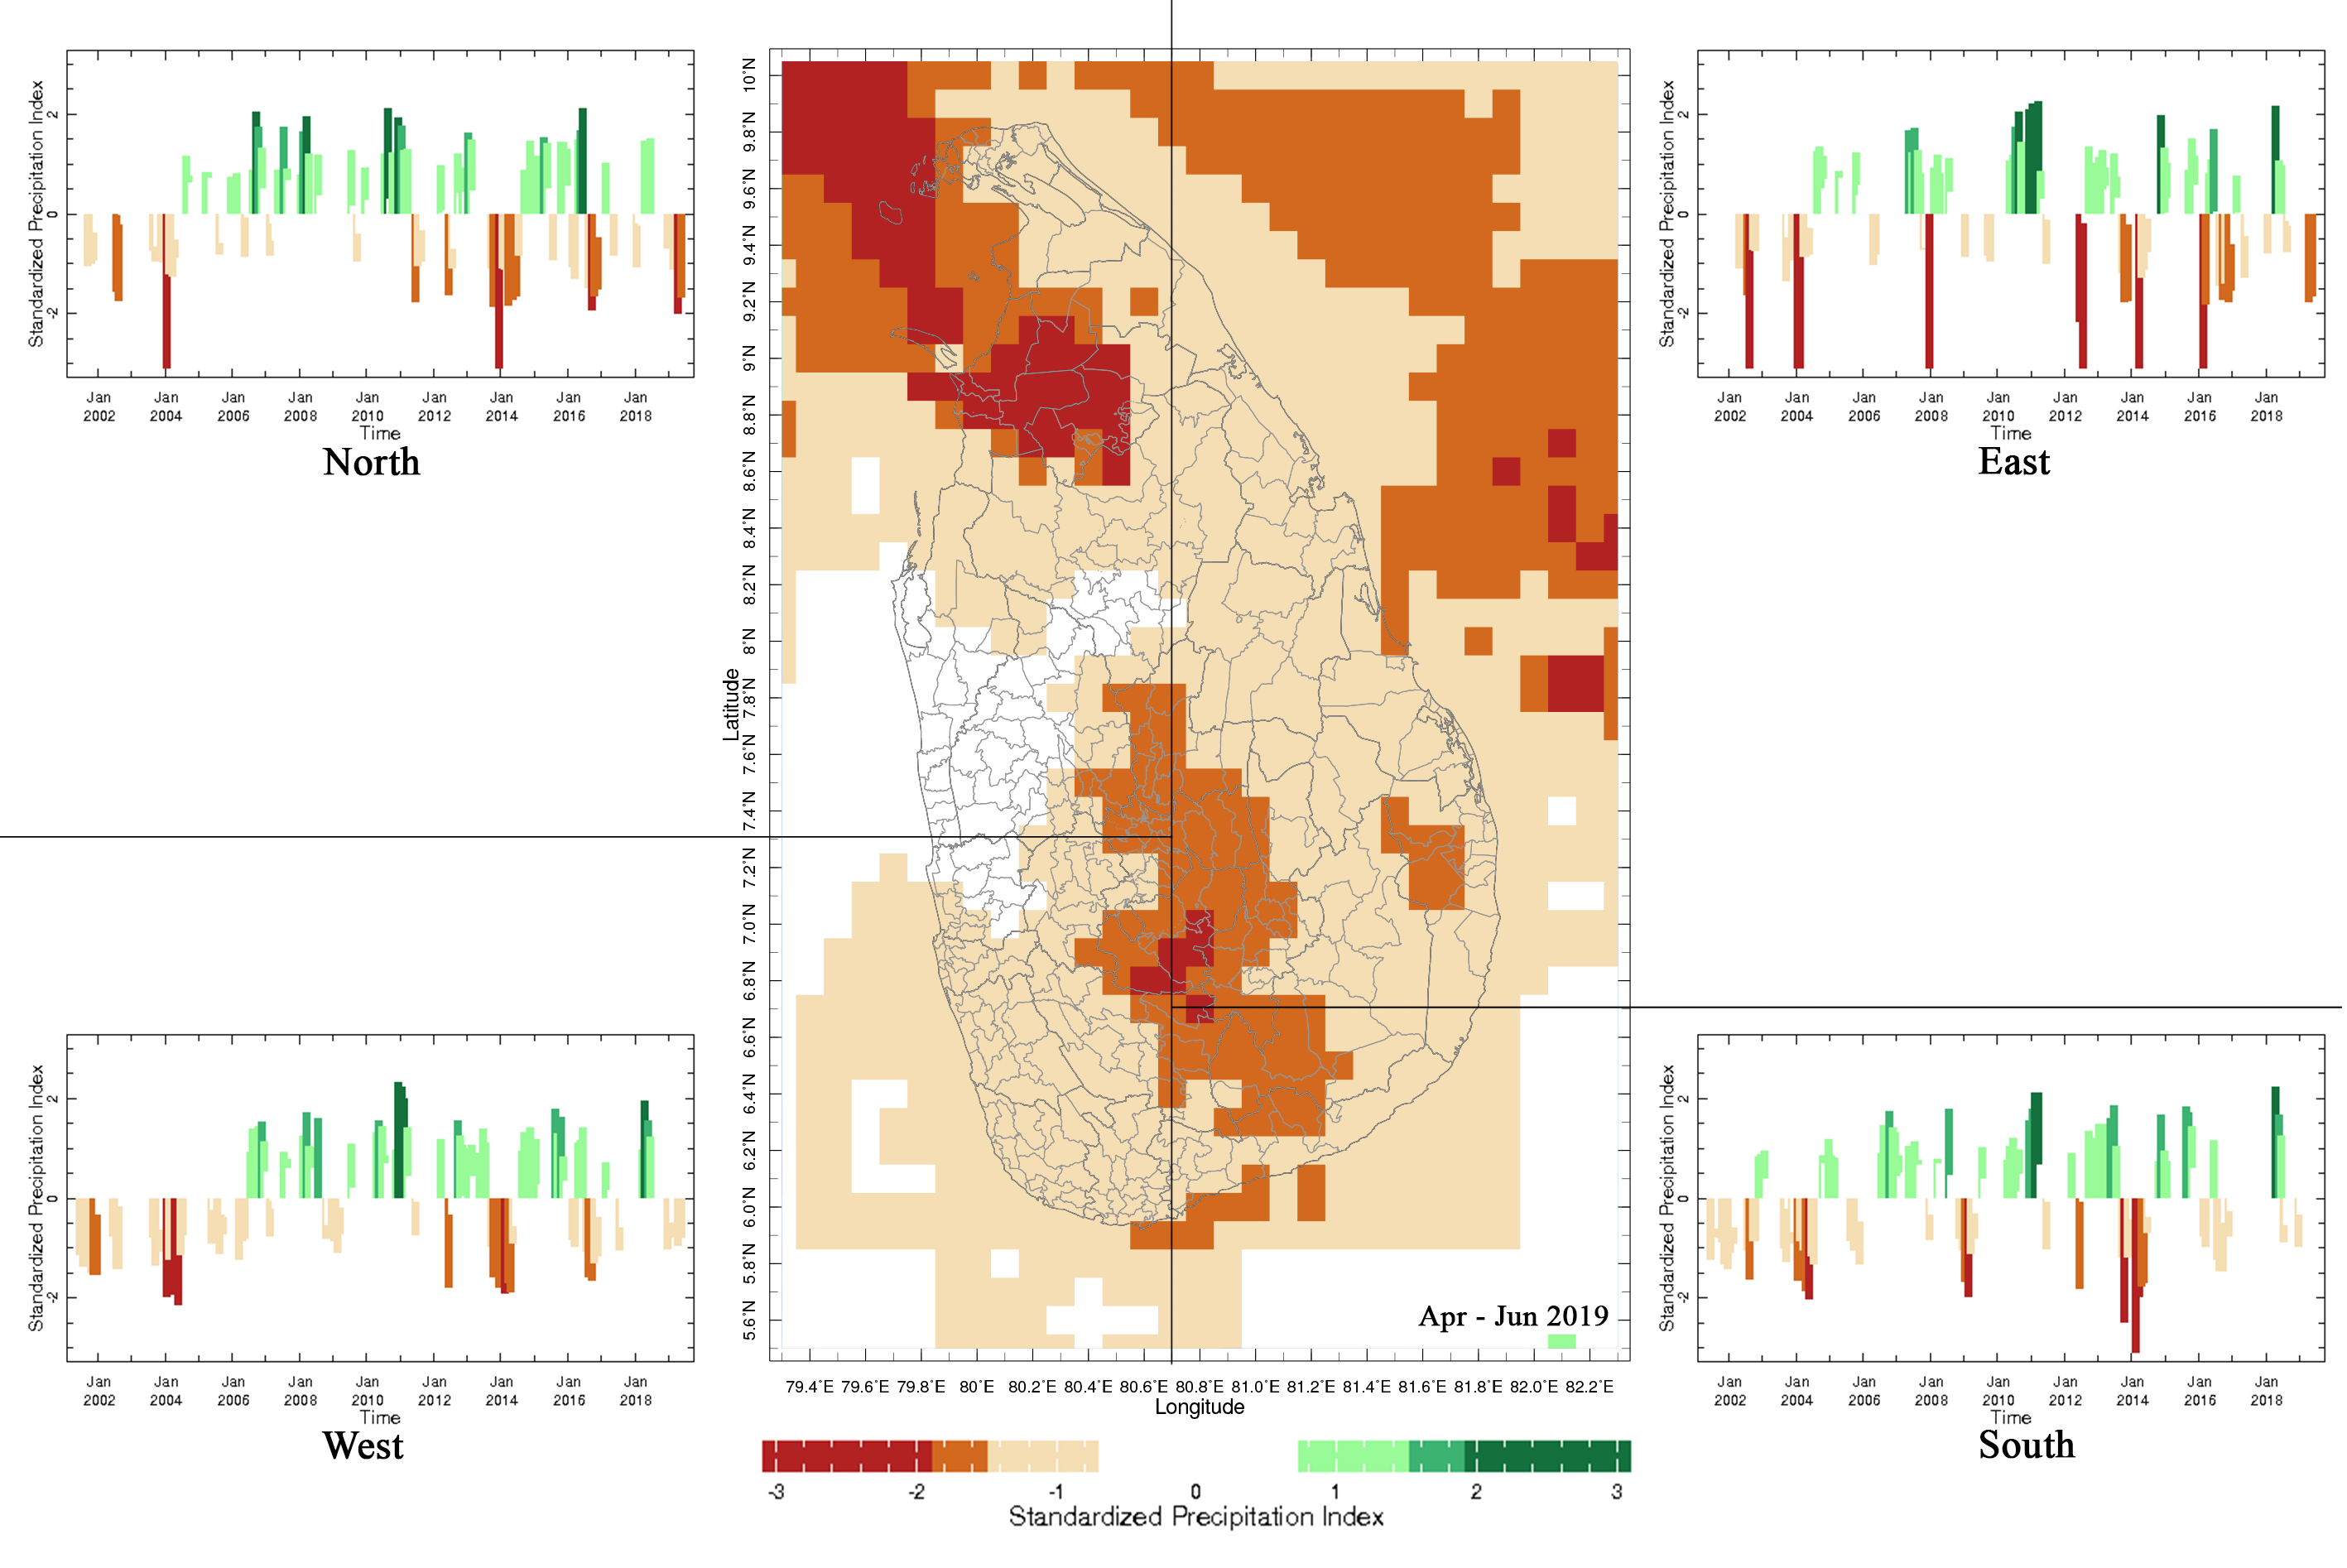
Figure 1: SPI Map for the recent 3 Months of 2019 (Apr-Jun) & 3 Monthly SPI Time Series for the 4 Climate Regions from May 2001 to Jun 2019
Three-monthly SPI time series graphs of each region are also shown in Figure 1.
- In North, Extreme droughts have occurred from Dec 2003 to Feb 2004 and from Dec 2013 to Feb 2014.
- In East, Extreme droughts have occurred in 2002 from Jul to Sep, Dec 2003 to Feb 2004, Feb to Apr 2014 and Feb to Apr 2016.
- In South, Extreme droughts have occurred from Oct to Dec 2013 and from Feb to Apr 2014.
- In West, Extreme droughts have occurred from Dec 2003 to Feb 2004 and from Apr to Jun 2004.
When considering the whole country, extreme droughts have occurred during the period from December 2003 to February 2004.
During this year, severe droughts have occurred in the period from March to May 2019.
Rainfall
Rainfall and its variation has the most direct influence on drought. If rainfall is less than what is typically expected and what folks and the ecosystems have grown accustomed to, then the impacts shall follow. Rainfall variation for drought monitoring needs to be done in near-real time. We have been working on various procedures so that we can overcome the nationally counter-productive data policies and pricing in place so as to bring out real time monitoring. We have found that satellite based data, some data that are accessible online and our own automated weather stations (which we provide unfettered access to) can be combined to estimate rainfall deficits. Below in Fig. 1 for example is a comparison of the current years rainfall with that in the previous years. We can see that in 2016 after the massive floods around 14-19th of May, rainfall has stayed well below what has been seen in previous years. Rainfall is usually high in the latter part of the year.
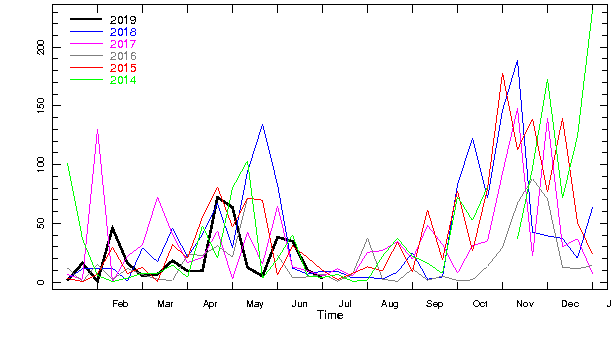
Figure 1: Dekadal (10-days or 3 per month) Precipitation Comparison for Sri Lanka
The average rainfall for each dekad over Sri Lanka estimated from satellites and ground observations is shown Figure 1 for the last 6 years as a line in a separate colour over a common January – December axis with 2019 in bold black. Figure 1 is already a harbinger of drougt in Sri Lanka by early January 2017. The deficits were sustained through April across Sri Lanka.
A more explicit way to look at drought is to compare the current rainfall average with that for the long-term average. This is what has been done in Figure 2. This too shows that the rainfall has been below average in a sustained way.
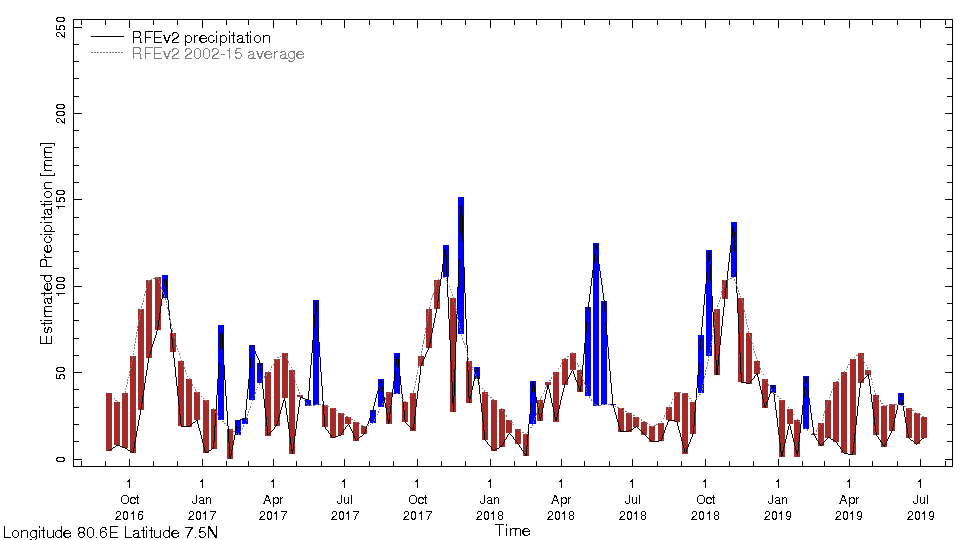
Figure 2: Dekadal Precipitation of Past Four Years and 2002-2019 Average for Sri Lanka
The smoother curve shows the average over 2002-2018 – this annual cycle is reproduced for each year in the above figure. The departures from this average are shown wetter (blue) and dryer (brown) for each month for the last three years. A dekad refers roughly to 10 days or more accurately as each month divided into three.
The climate of Sri Lanka has considerable regional variation – to undertand this, we can look at the month-by-month variation in rainfall anomalies (Fig. 3) – i.e the departure from the long-term average. The maps show more nuance and can be interpreted accordingly for various regions.
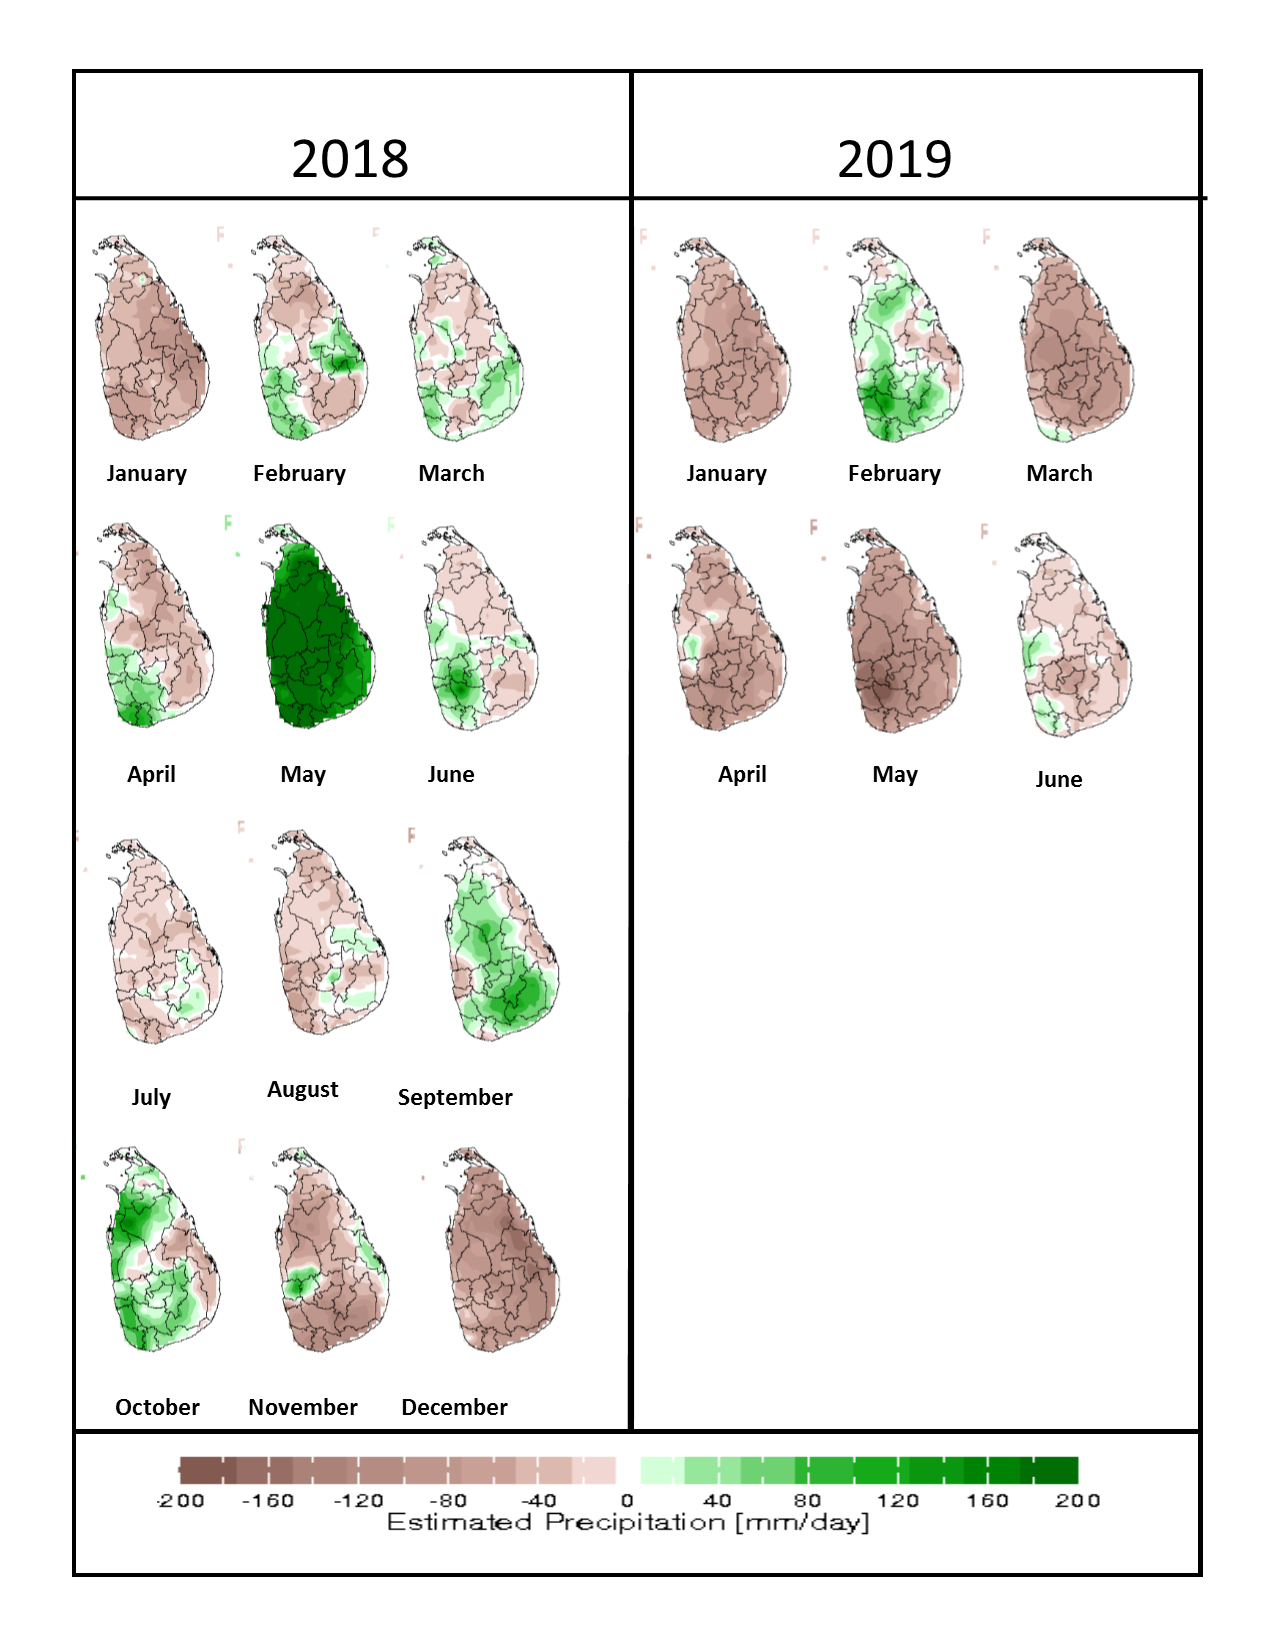
Figure 3: Monthly Precipitation Anomalies for 2018 and 2019
Temperature and Heat Index
Temperature
Drought can also be exacerbated by excessive evaporation from water surfaces such as lakes and evapo-transpiration from flora. Evaporation data while available are not yet being accessible in real time. Hence we are left with various steps to find suitable proxy for now. Remote sensed based observations of vegetation is a possibility and in our drought monitor we shall soon provide such estimates. The variables that affect evaporation are temperature, wind, and relative humidity – of these temperature is critical. Below, we see that the temperature over Sri Lanka plays a major role in the effecting of a drought.
.png)
Figure 4: Tempertaure in Sri lanka from 1970-2000 Average, 2017,2018 and 2019
In climate change studies, temperature anomalies are more important than absolute temperature. A temperature anomaly is the difference from an average, or baseline, temperature. The baseline temperature is typically computed by averaging 30 or more years of temperature data. A positive anomaly indicates the observed temperature was warmer than the baseline, while a negative anomaly indicates the observed temperature was cooler than the baseline
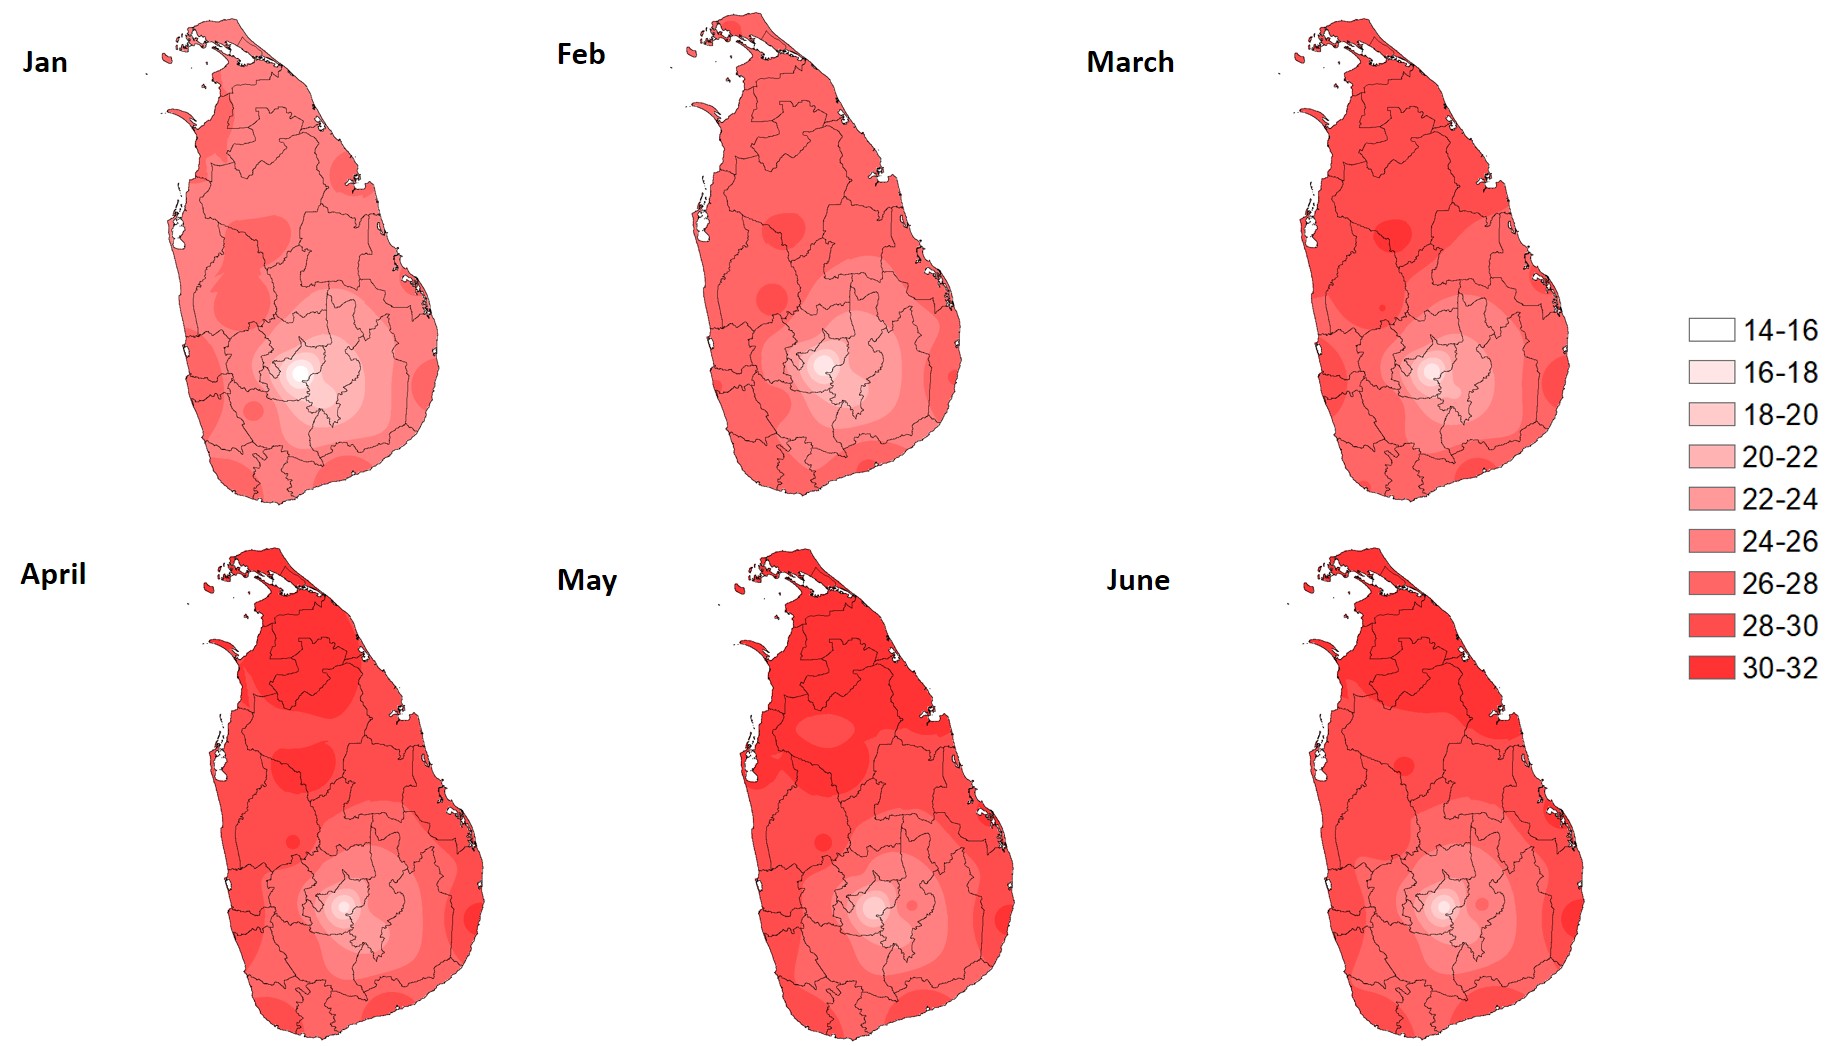
Figure 5: Monthly Average Temperatures of Sri Lanka for the First 6 Months of 2019
Figure 2 shows the monthly average Temperature of Sri Lanka for the First six months of 2019. The monthly average temperature is varying from 14 to 32 and the temperature values are higher compared with the previous years. Figure 3 shows the month-by-month variation in temperature anomalies to understand the regional variation of temperature.
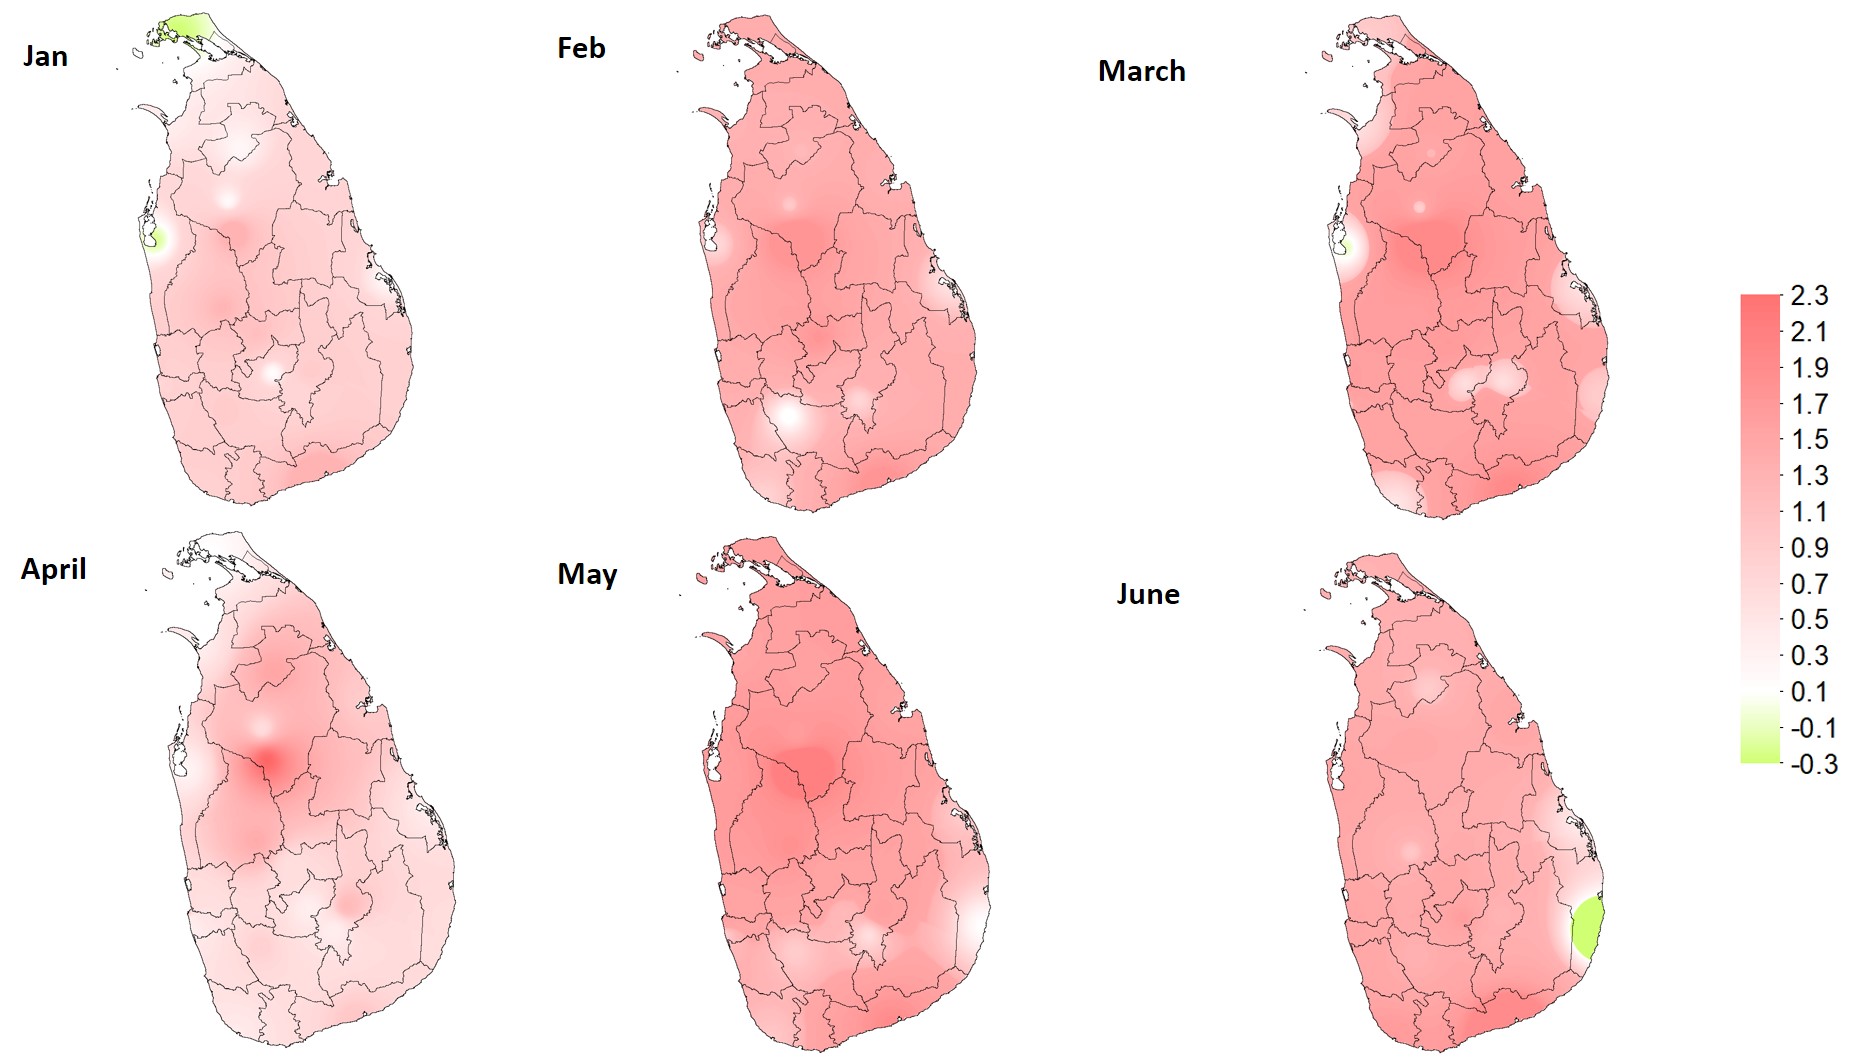
Figure 6: Monthly Temperatures Anomalies of Sri Lanka for the First 6 Months of 2019
Heat Index
Generally in weather reports, they give an actual temperature and then a feels like temperature. This feels like temperature is much higher than the actual temperature.This feels like temperature is known as Heat Index.
What is Heat Index?
- Actual Temperature
- Humidity
-
Heat Index is developed from a mathematical formula
- HI = -42.379 + 2.04901523 * T + 10.14333127 * RH - 0.22475541 * T * RH - 0.00683783 * T * T - 0.05481717 * RH * RH + 0.00122874 * T * T * RH + 0.00085282 * T * RH * RH - 0.00000199 * T * T * RH * RH
where
- RH=Relative Humidity
- T= Temperature in Farenheit
When the atmospheric temperature is high, warmer air holds more moisture. Then the relative humidity is very high, then the heat index or the feels like tempearture gets even higher which means the body can't cool itself which may cause in consequences such as heat cramps, exhaustion and heat stroke.
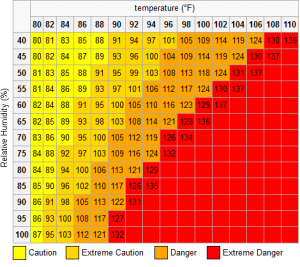
Figure 7: Standard Heat Index Table
Generally, when the heat index gets higher than 105, it is not good. So it is very essential to use not only the outdoor temperature, but also the heat index, when planning outdoor activities.
Annual-Monthly Variation of Heat Index
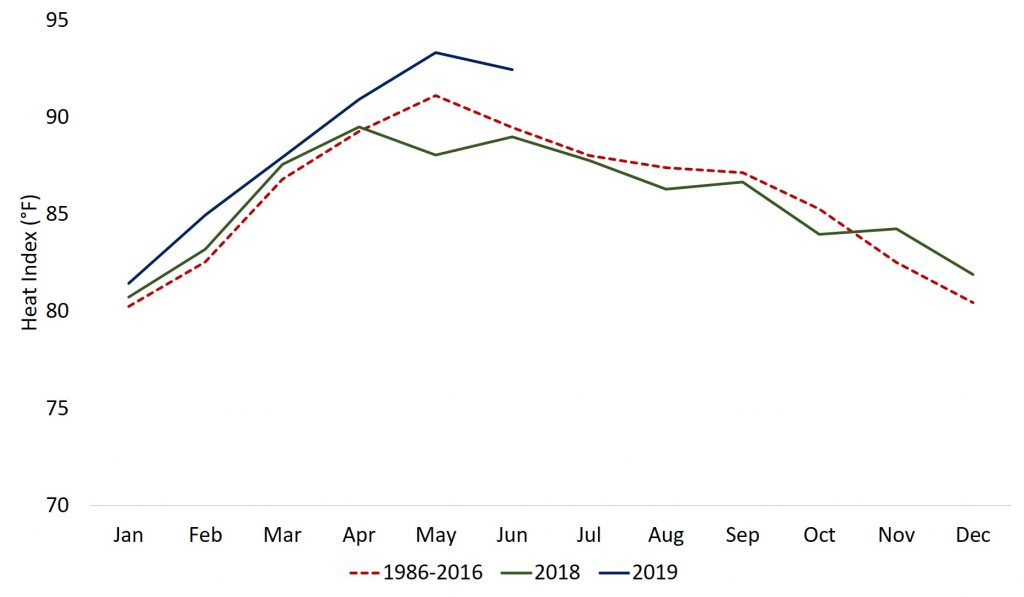
Figure 8: These cycles are characterized by mean of monthly Heat Index values over the period 1986-2016
An upward shift in the HI values is noticeable throughout 2019.
Monthly Average Heat Index 2019
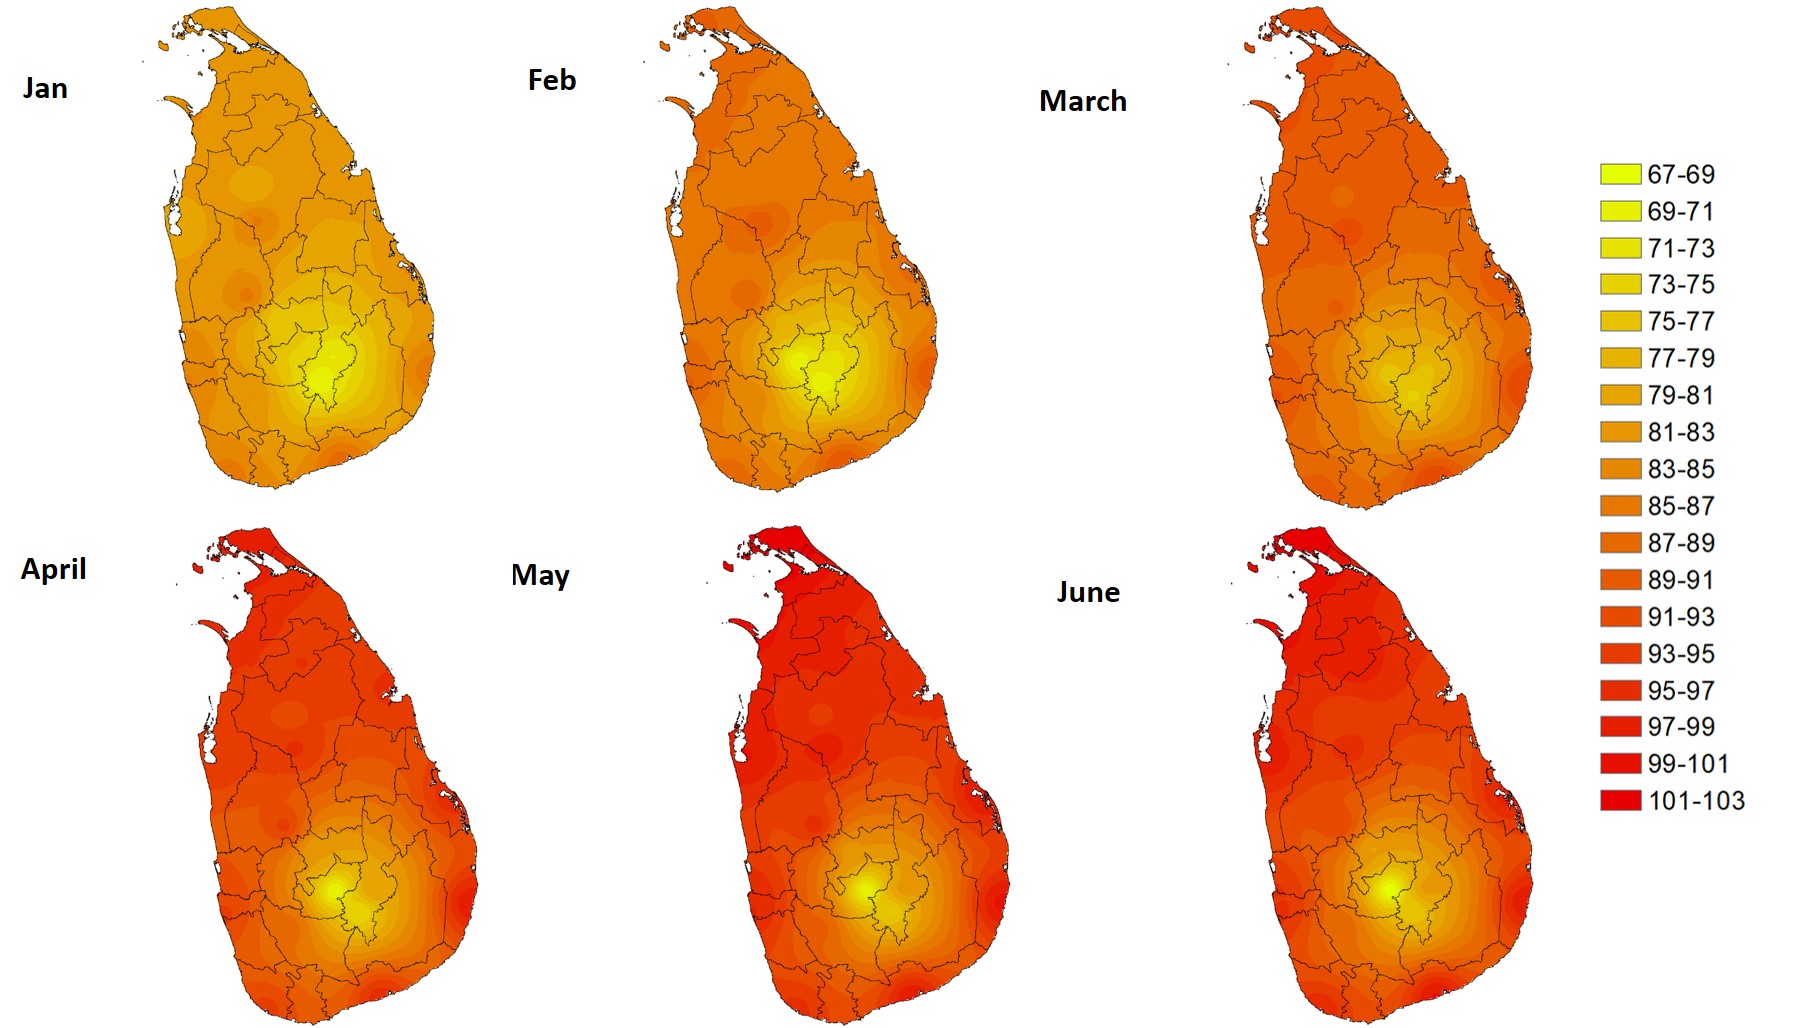
Figure 9: Monthly Average Heat Index of Sri Lanka for the First 6 Months of 2019.
*For Sri Lanka, the color scale used for Heat Index mapping is different from the standard color scale of Heat Index.
Evaporation and Evapo-Transpiration
This web page is under construction