Climate of Comoros

Comoros is a tropical island with warm and humid conditions along with strong seasonality in rainfall. The high mountains of the Comoros has profound influences on the regional variation of climate. Comoros lies midway between the equator and the Southern limit of the tropics.

The climate is  hot and humid from November to April,  and a cooler, drier season the rest of the year. Average monthly temperatures range from 23° C to 28° C along the coasts.

Although the average annual precipitation is 2,000 millimeters, water is a scarce commodity in many parts of Comoros. Mwali and Mahoré possess streams and other natural sources of water, but Njazidja and Nzwani, whose mountainous landscapes retain water poorly, are almost devoid of naturally occurring running water.

Cyclones, occurring during the hot and wet season, can cause extensive damage, especially in coastal areas. On the average, at least twice each decade houses, farms, and harbor facilities are devastated by these great storms.

The high mountains of the Comoros leads to mountain induced rainfall in its slopes towards the windward side.

In the description below, we shall describe the average monthly conditions of wind, temperature and rainfall over Comoros. This is the first step in a climatic analysis. We shall add further work on temporal and spatial climate variability in the coming months.

Average Monthly Wind Circulation


The average monthly wind speed and direction at roughly 750 m elevation (925 mb pressure level) is depicted in the animation below.  The estimates for wind are made from satellite observations and ground based observations by NOAA CPC. The average is over the period in which satellite data is available (since 1979).The direction of wind is shown by the direction of the arrow and the size of the arrow indicats the speed of wind. Note that, In the animation, the month is shown in the bottom left hand corner.

The seasonal north-south migration of the (Inter-)Tropical Convergence Zone (TCZ) crosses the Comoros around  November on its way South and around April on its way North. This may be seen in the monthly average wind charts shown below.  The TCZ may be eyeballed as the region where the wind speed diminishes and there is convergence of wind from both North and South. 

Wind Climatology

Monthly Average Mean Temperature


The mean temperature variation by month over the larger region is shown. The variation for Comoros may be interpolated with adjustments to be made for elevation and wind effects. The month is indicated at the bottom left of the animation.
 
Land Temperature Around Comoros
Land Temperature UEA Scale

Monthly Average Rainfall


The average monthly rainfall for the larger region is shown below along with the wind vectors. These estimates are also are made both from satellite observations and ground based observations every month by NOAA CPC. wind is shown by arrows. The colorscale at the bottom shows the magnitude of rainfall over the year. The heavy rainfall bands roughly migrate with the ITCZ. So the rainfall around Comoros tends to be high from November to April.

Note, these estimates are based on coarse data and do not capture local effects such as due to mountains and cyclones which can be profound.

Rainfall over Southern Africa and Indian Ocean
prcpscale

Climatology

PRECIPITATION


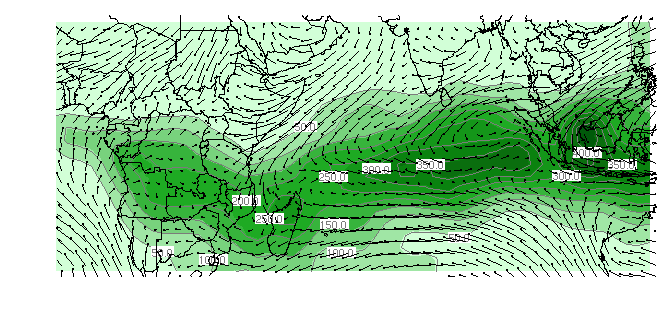
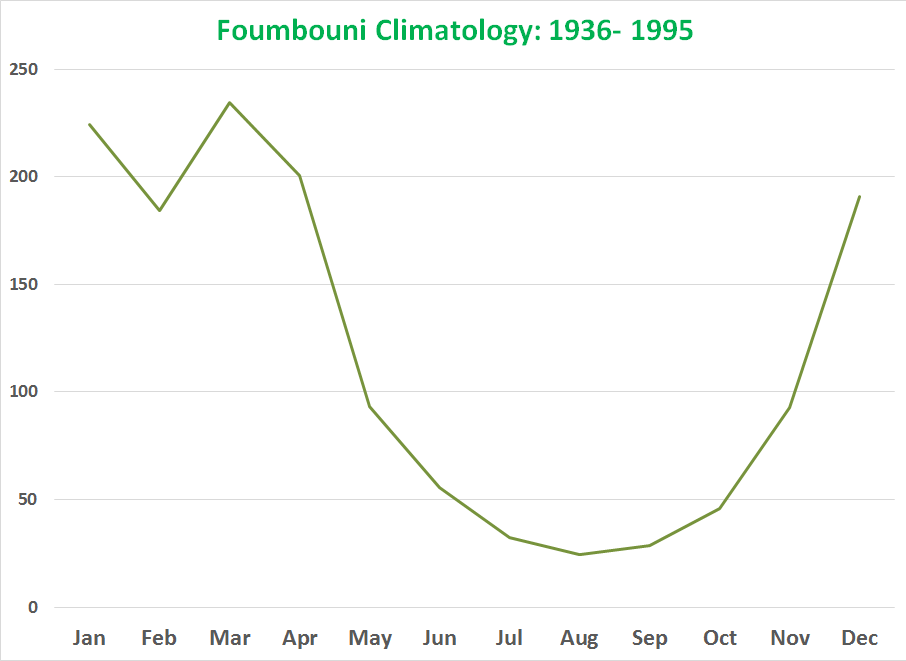
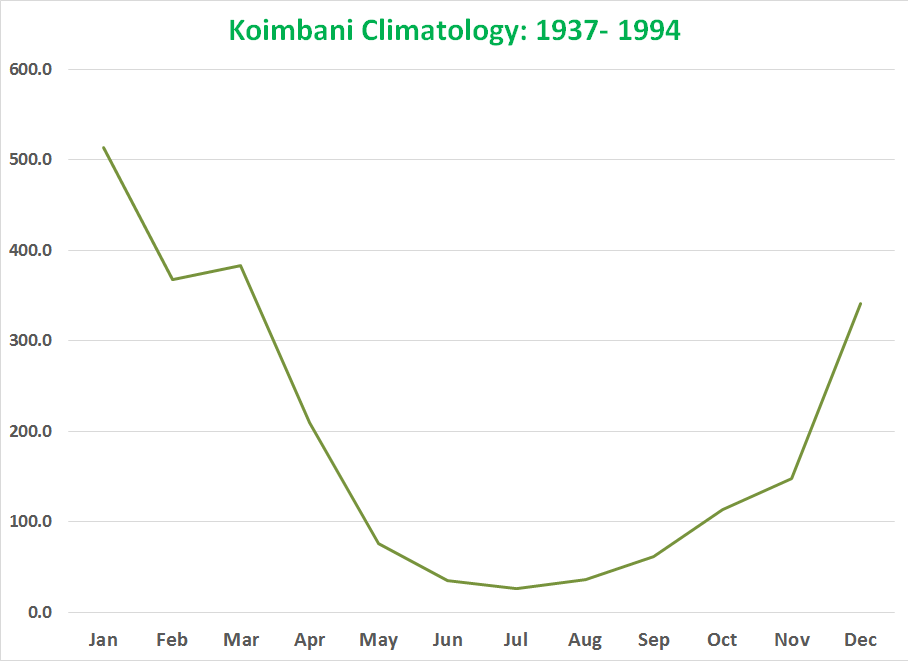
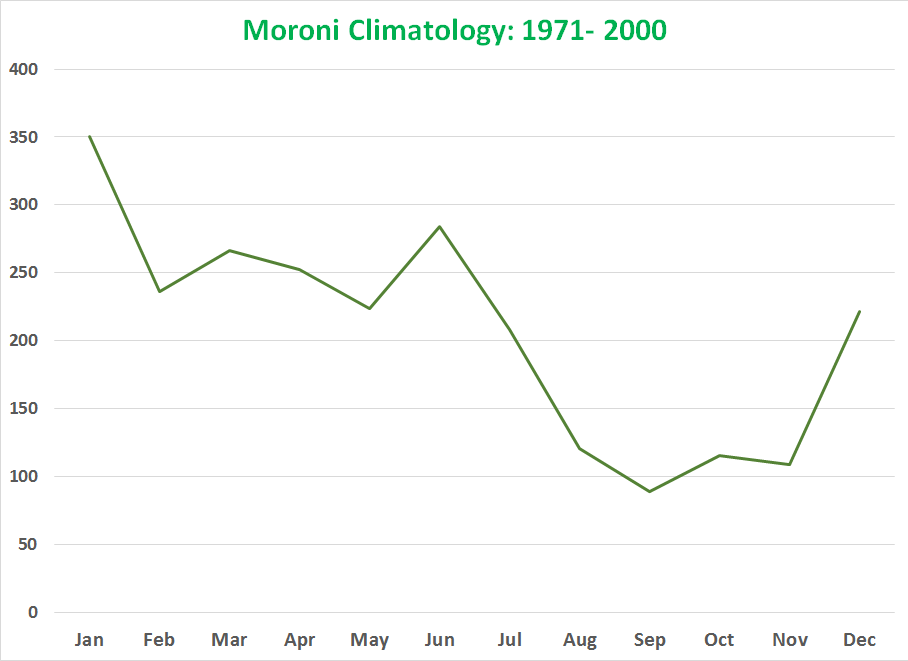
Following three figures show the precipitation climatology of Foumbouni, Koimbani and Moroni areas of Grande Comore island. Both Foumbouni and Koimbani are in the eastern coast of the island while Moroni is in the western coast of the island. These plots show that higher precipitation is observed in December to March and during July and August lower precipitation is observed. Precipitation is shown in millimetres.

Foumbouni Koimbani Moroni

TEMPERATURE


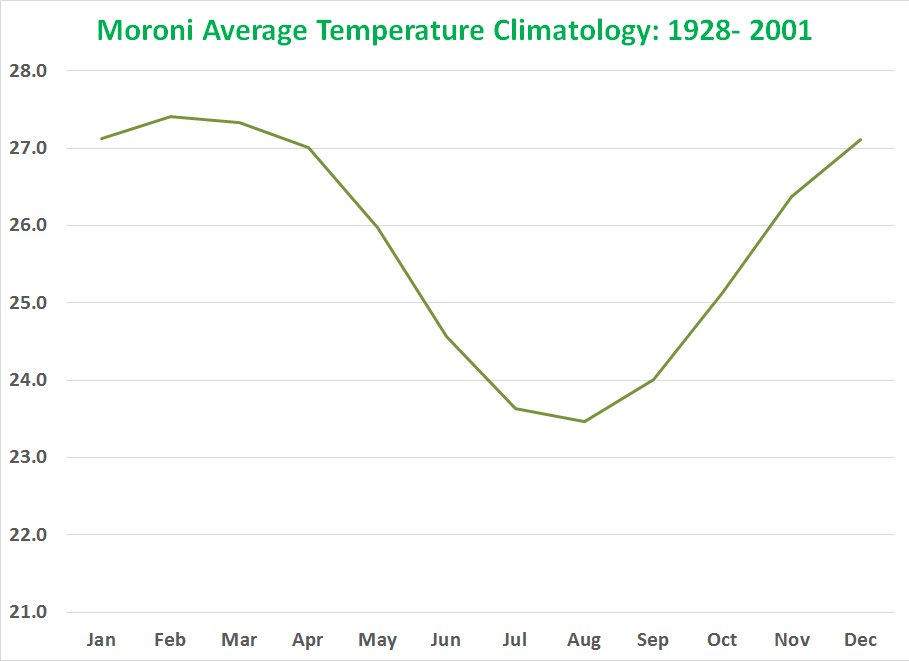
Following figure shows the average temperature climatology of Moroni. The temperature is shown in degrees Celcius.

Moroni