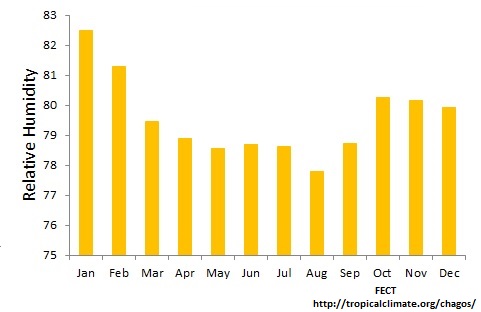
Chagos Archipelago has a tropical marine climate with consistently high temperatures (daily highs (year-round) average near 88 °F while lows seldom fall below 75 °F) and elevated humidity levels. The climate is governed primarily by the seasonal migration north and south across the area of a zone of equatorial westerlies separating the Northeast Trades and the Southeast Trades. During December-March winds are variable but mainly westerly. April and May represent transitional conditions, with the westerlies weakening and the south-easterlies becoming more important. June, July, August and September form the season of the Southeast Trades, with dominant direction 120° -150°. By September the Trades begin to weaken, and spread from east to south. October and November represent a second transition period. Winds are variable, though still concentrated at 90° -120°.
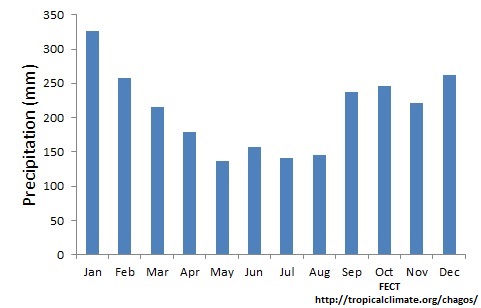
The islands of the Chagos Archipelago are the wettest coral islands in the Indian Ocean, with mean annual rainfall of up to more than 3700 mm. Rainfall is high and fairly evenly distributed. The mean annual rainfall for the periods 1937-38 and 1951-66 is 2599 mm, but actual annual totals, however, vary from 1465 mm to 5805 mm. Varying rainfall lies across the northern part of the Chagos between Addu and Diego Garcia: from Diego Garcia to Salomon, a distance of 220 km, there is a rainfall gradient of approximately 6 mm per km. Monthly rainfall at Diego Garcia is highest in January, February and October, and lowest during the Trades, in April to August, when the monthly mean is less than 200 mm.
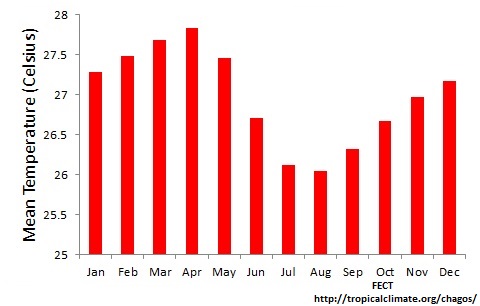
The temperature regime follows the seasonal wind pattern. During the period of Equatorial Westerlies and calms, temperatures are higher than during the Trades. Mean monthly temperature varies from a maximum of 30.75 °C in March to a minimum of 28.0 °C in August, an annual range of 2.7 °C. Similar variations occur in monthly mean minimum temperatures from 25.4 °C in April to a minimum of 23.89" in August.
Tropical cyclones are rare in Diego Garcia because of the low latitude. Fresh westerly winds may be experienced when cyclones form or pass to the south of the Atoll. Tides at Diego Garcia are semi-diurnal, and rather greater in amplitude that those of the southern Maldives. (Stoddart, D.R., 1971)
Climatology of Chagos
The data we gathered for climatological analyses gives slightly different values for mean temperature and precipitation for Chagos, compared those of Stoddart’s Atoll research bulletin. The mean annual maximum temperature and minimum temperature are 30.5 °C and 24.8 °C respectively with the mean annual temperature being 27.0 °C. April has the highest monthly mean temperature of 27.9 °C and August has the lowest of 26.0 °C. Mean annual precipitation derived from gathered data is 2524.2 mm. This discrepancy between climatological values may be due to the differences in the periods of time the data was gathered.
Climate Change
The archipelago consists of a wide range of reef island types (atolls, vegetated and unvegetated sand cays). These islands are subject to a combination of regional oceanographic factors including the Indian Ocean Dipole, reversing annual monsoons, the Southern Equatorial Current and seasonal Tropical Cyclones.
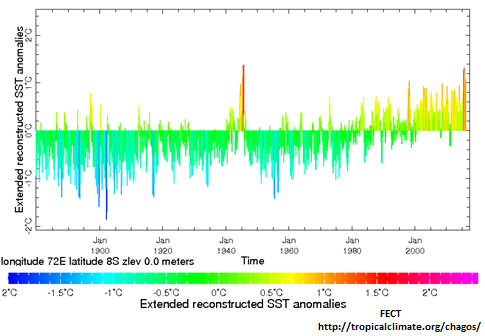
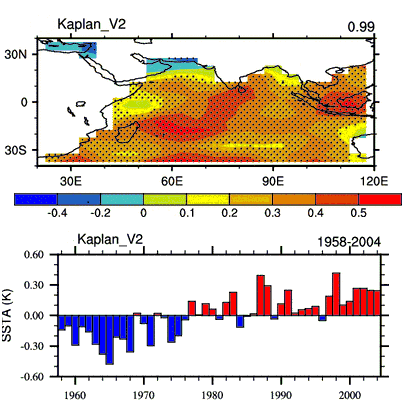
For approximately eight months of the year the prevailing winds blow from the southeast, with remaining seasons fluctuating between westerly winds and transitional conditions. This regime is reflected in the local wave climate and the islands therefore have a natural history of geomorphic mobility due to seasonal shifts in sediment supply, storm and wave activity. Indian Ocean reef platforms and the islands they support have stabilized in their current configuration as Holocene sea levels have slowly risen over the past 6000 years. However, their response to more recent climatic changes such as accelerated sea level rise, coral bleaching and increased intensity of storms have shown great variability across different localities. Regional sea surface temperature increases have reduced live coral cover through bleaching across several of the reef platforms, most notably from the 1998 warming event associated with the El Nino Southern Oscillation.
The archipelago is vulnerable to the physical pressures from global warming and climate change. These include:
As the islands, are mainly less than two metres above sea-level, they are increasingly vulnerable to erosion, loss of fresh water supplies, flooding, property damage, transportation disruptions and other effects of rising sea-level. (Stoddart, D.R., 1971)
Sea Level Rise
There is considerable interest in the long-term consequences of global warming on sea level, both globally and at the regional or local level. The current consensus is that global mean sea level has risen at a rate of about 2 mm yr-1 during the 20th century, and at about 3.2 mm yr-1 over the last 20 years, but there is also large variability in the magnitude at regional scales. In the Indian Ocean, in particular, recent studies have highlighted the large degree of spatial variability in sea level. According to the most recent assessment of the Intergovernmental Panel on Climate Change, current estimates project a sea level rise of 0.5 to 1.2 meters by 2100, with the possibility of several more meters beyond.
Rising sea levels are of particular relevance to low lying coastal areas of the world, including the coral atolls and islands of the world’s tropical oceans. In this context, the coral atoll islands of the Chagos Archipelago are vulnerable, although they lie close to an area of the Indian Ocean where studies have suggested that recent sea-level rise may have been small. The island of Diego Garcia in the Indian Ocean is a critical logistics hub for U.S. and British forces in the Middle East. Due to its exposure to the extreme weather in the Indian Ocean, changing temperatures and increasing rainfall, Diego Garcia faces the threat of coastal erosion and flooding. The highest point above sea-level is 22 feet, but the island’s mean height above sea-level is 4 feet. Diego Garcia is threatened by the effects of climate change because its average height above sea level is just over one meter. A sea-level rise of a several feet would force the US military to undertake a costly and difficult military relocation process.
In 2003, based only on short tide-gauge data sets, Sheppard and Spalding (2003) examined the records on Diego Garcia in the south east of the archipelago and concluded that relative sea level had risen at a rate of 5.44 mm yr-1 over the period 1988 to 1999. A subsequent analysis of the same record for the period 1988 to 2000 reported a rise of 4.35 mm yr-1.
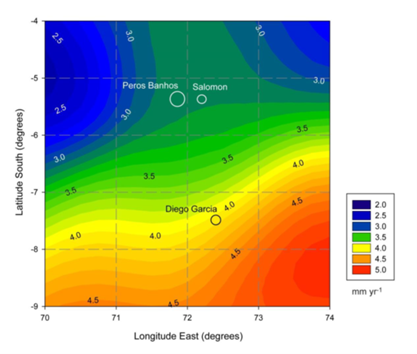
In 2012 a detailed examination of sea-level trends, vertical land movement, storminess, and the ocean wave climate in the Chagos Archipelago done by Dunne et al., concluded that the Chagos islands had experienced a relatively stable physical environment over the last 20 years. He says that rates of sea-level rise had not been larger than the generally-accepted rate of up to 2mm yr-1 for 20th century global-average sea-level rise, and there was no evidence of any change in the magnitude or frequency of waves (wind and swell), such that the impacts on the islands (erosion and inundation) had not increased. A recent study of regional sea-level change over the last century suggests that Chagos sea level rose by about 6 mm yr-1 during the first half of the 20th Century (1901-1949) decreasing to 2 mm yr-1 in the latter half (1950-1999). The satellite altimetry data (1993 – 2014) analysis shows a pattern of higher rates of sea-level rise in the southern part of the region (70-74oE and 4-9oS), decreasing northwards. Sea level in the Chagos is rising more slowly than in many other parts of the world’s oceans. The data from a tide gauge at Diego Garcia and from satellite measurements of the ocean height, which between them span the past 23 years show a ‘best estimate’ of 2.2 mm yr-1 which cannot be confirmed as a True rate because of the variability.
These are the new findings of an expert study published in the journal ‘Global and Planetary Change’ (Vol 82-3:25-37), entitled “Contemporary sea level in the Chagos Archipelago, central Indian Ocean”. Here the authors, have presented the first comprehensive analysis of sea level, storms and cyclones, waves and wind, and the past effects of tsunamis on the islands of the Chagos Archipelago. Their principle findings are that:
The authors concluded that “Collectively, these results suggest that this has been a relatively stable physical environment, and that these low-lying coral islands should continue to be able to support human habitation, as they have done for much of the last 200 years.” (Dunne, R.P, 2012)