 |
FOUNDATION FOR ENVIRONMENT, CLIMATE AND TECHNOLOGY
|
| www.climate.lk
|
www.tropicalclimate.org/maldives |

The following figures show the satellite observed rainfall in the last 7 days in Sri Lanka.
 |
 |
 |
 |
 |
 |
 |

The following figures show the total satellite observed rainfall in the last week in Sri Lanka. The figure in the left is the total 7-day rainfall from NOAA Climate Prediction Center (CPC) Unified Precipitation Analysis and the figure in the right is the total 7-day rainfall from CPC RFE 2.0 Satellite Rainfall Estimates. The bottom two figures are the respective anomalies.
 |
 |
 |
 |
The figure in the left shows the average observed rainfall in the previous month. The rainfall anomaly in the previous month is shown in the figure to the right. The brown color in the anomaly figure shows places which received less rainfall than the historical average while the green color shows places with above average rainfall. Darker shades show higher magnitudes in rainfall
  Monthly Average |
  Monthly Anomaly |
The figure in the top-left shows the total rainfall in the past 30 days from CPC Unified Precipitation Analysis while the figure in the top-right shows the total rainfall for the same period from RFE 2.0 Satellite Rainfall Estimates. The bottom two figures show the percentage of rainfall received in the past 30 days compared to normal rainfall in this period.
 |
 |
 |
 |
The following figure shows the observed accumulated rainfall (top) and daily observed rainfall (bottom) in Sri Lanka in the last 30 days.
 |
  |
  |
 |
 |
 |
The following figures show the mean vector wind total of the past 7 days near Sri Lanka at two levels. The figure on the left shows 850 mb (~1500 m) level and the figure on the right shows 700 mb (~3000 m) level.
 |
 |
Weekly average Sea Surface Temperature (SST) anomaly in the world from NOAA NCEP
  WORLDBATH topography |
Optimum Interpolated Sea Surface Temperature Anomaly in the Indian Ocean from NOAA CPC
 |
 |
 |
 |
 |
 |
 |
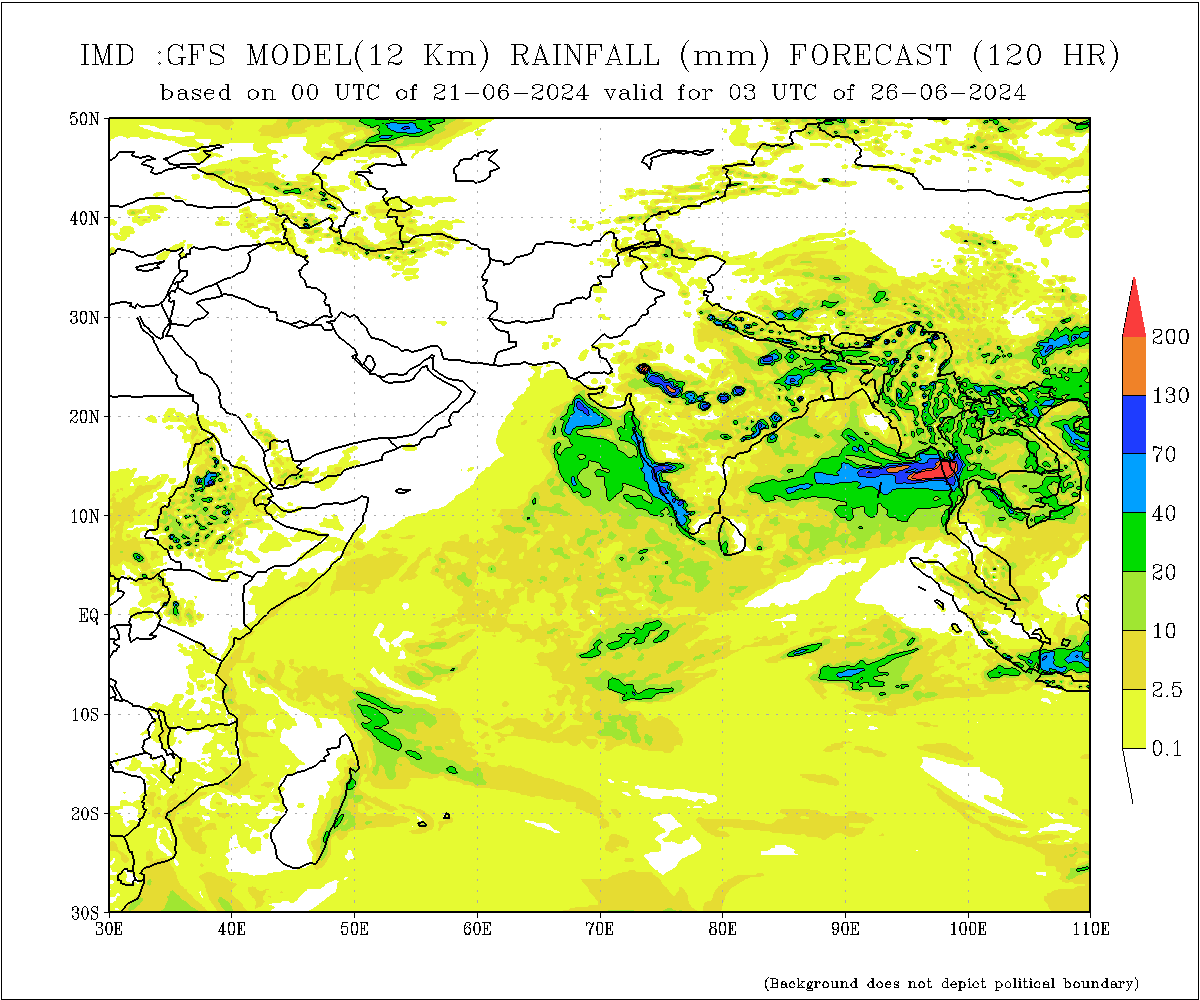 |
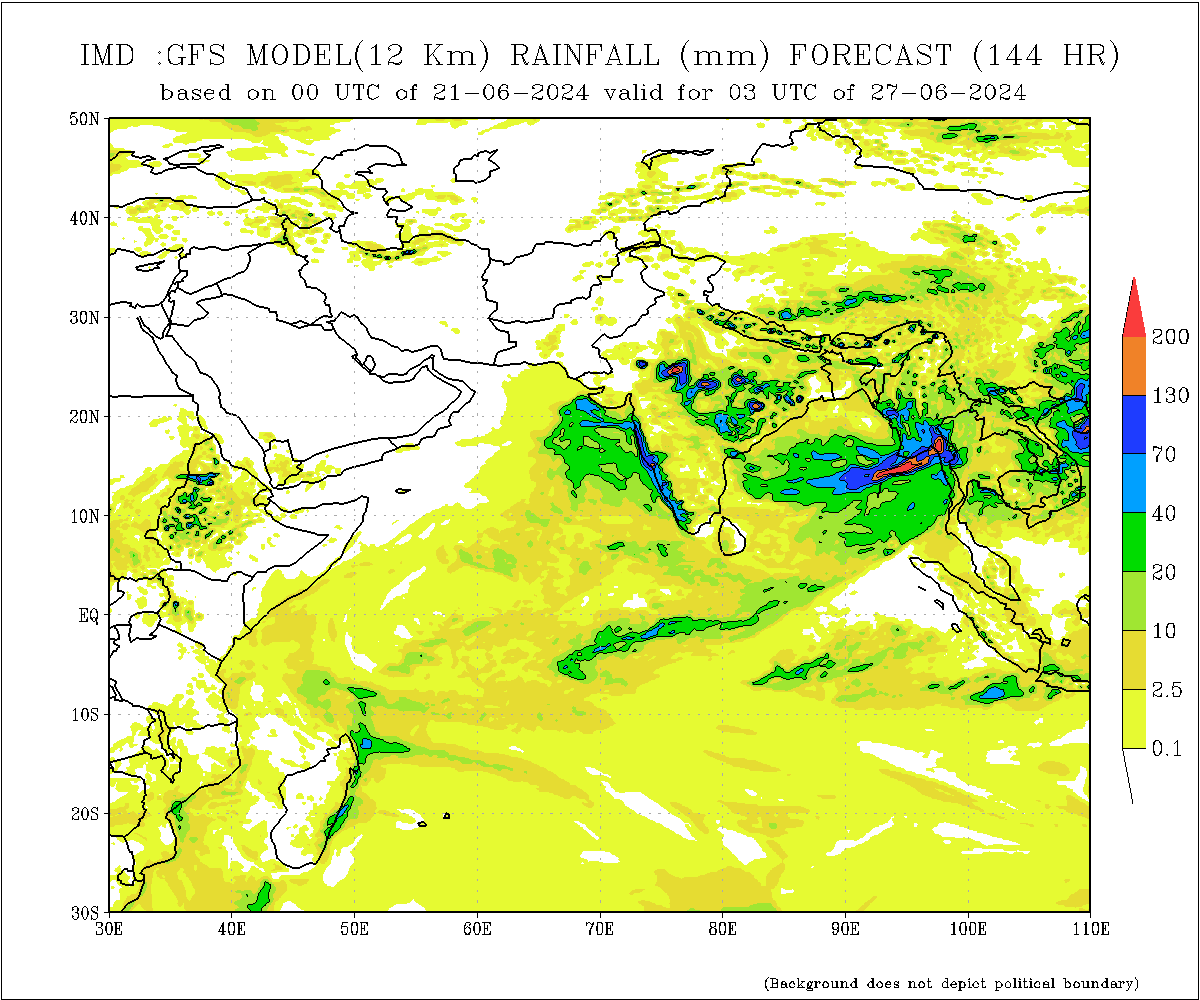 |
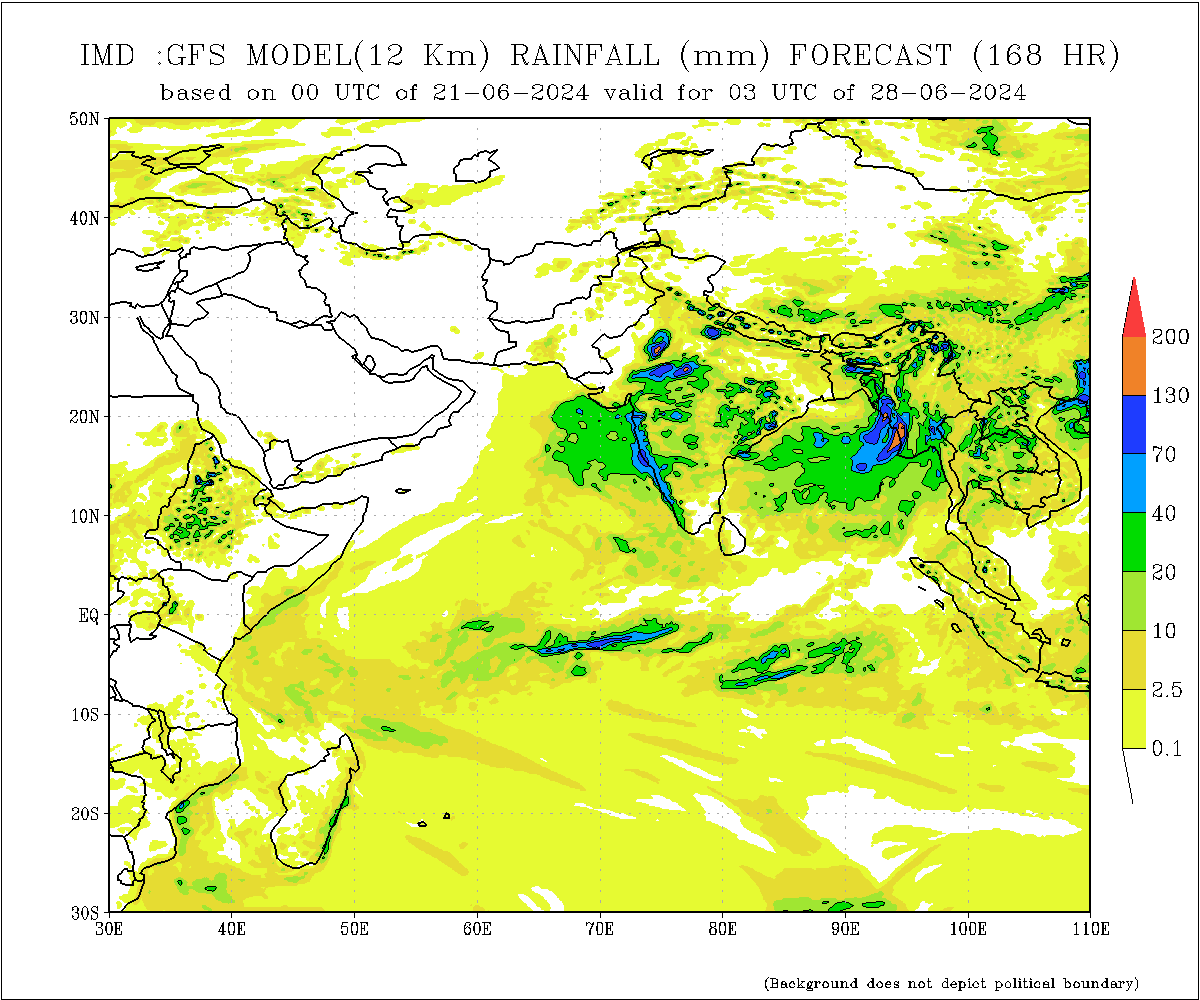 |
|
 |
 |
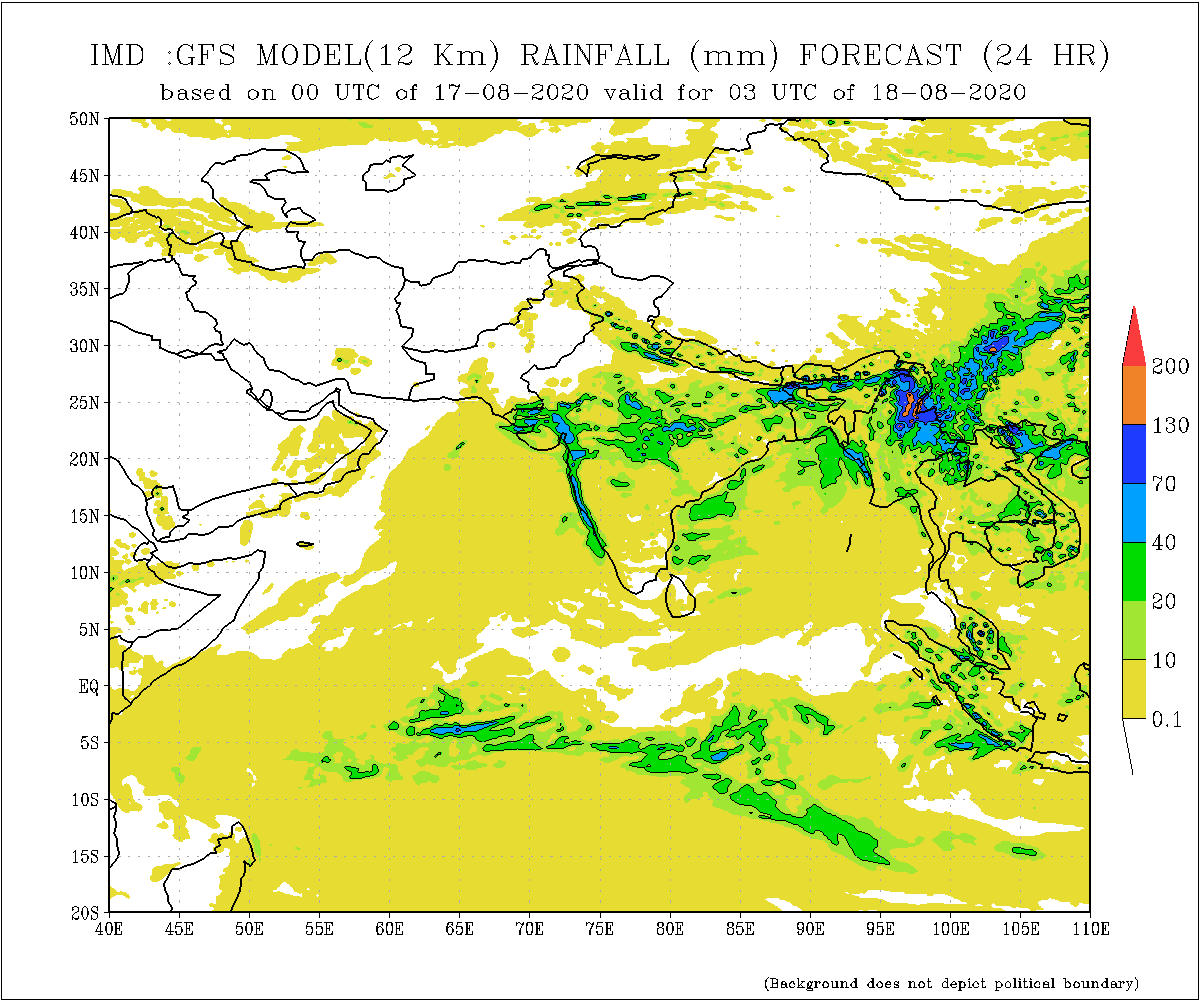
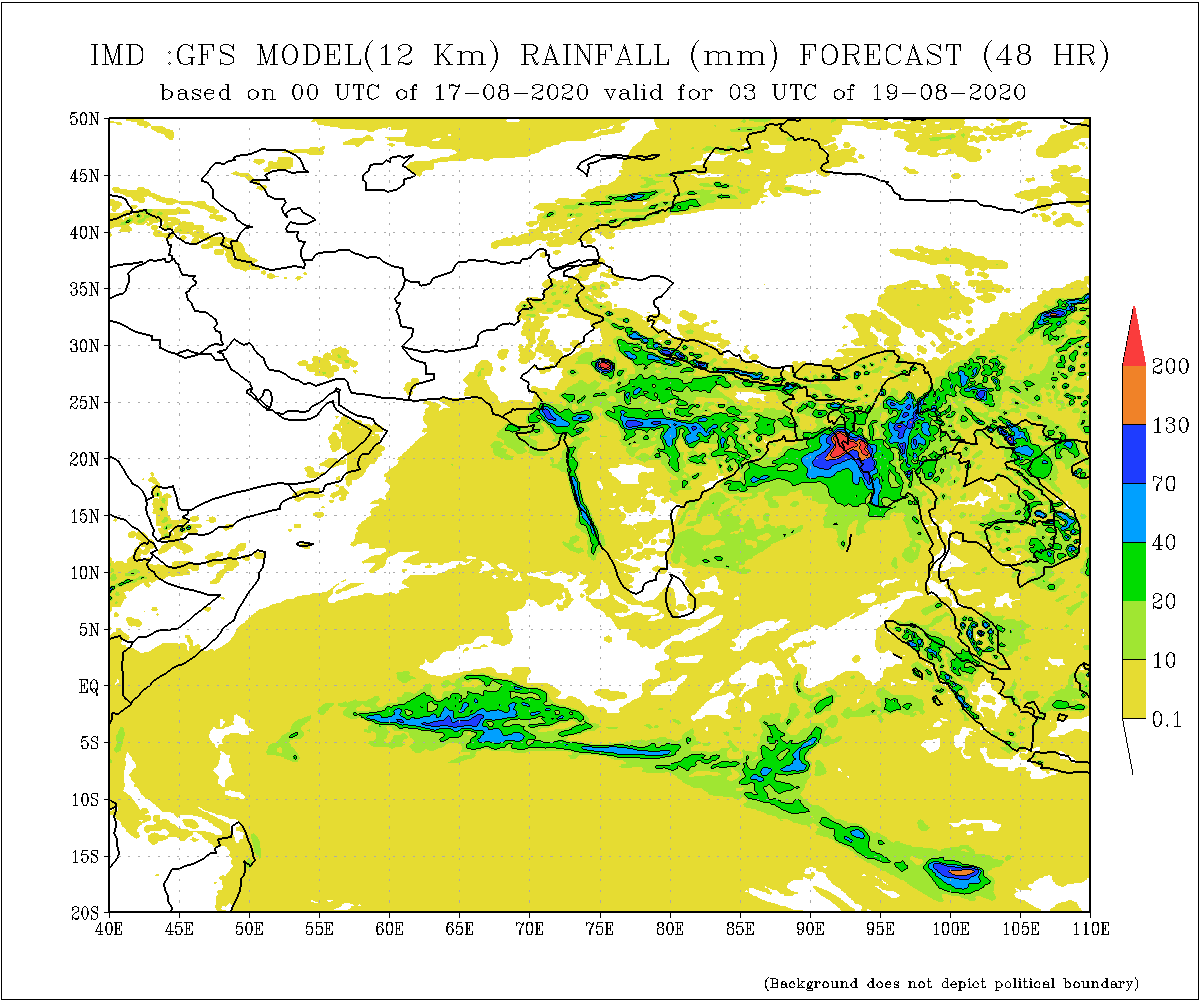
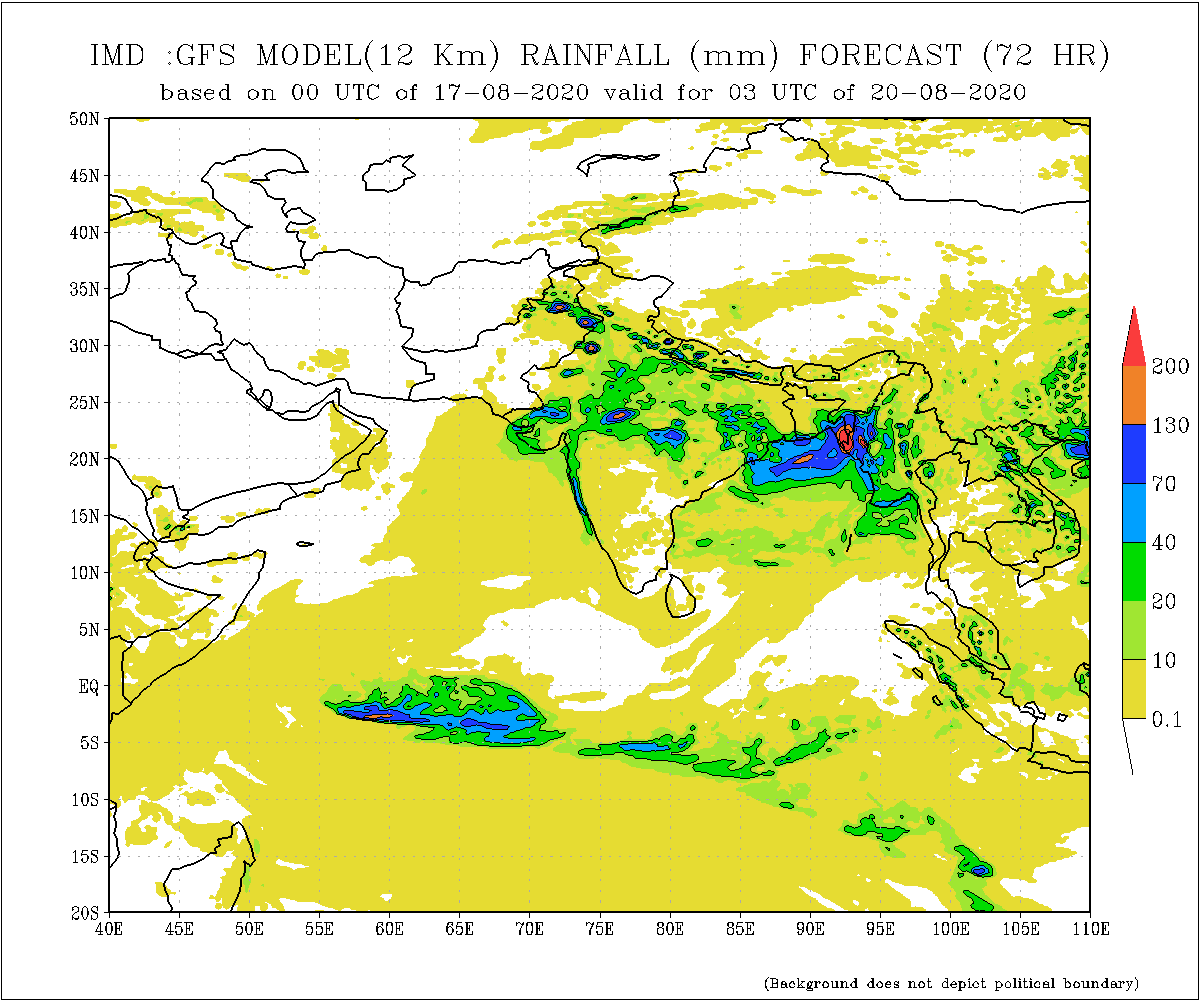
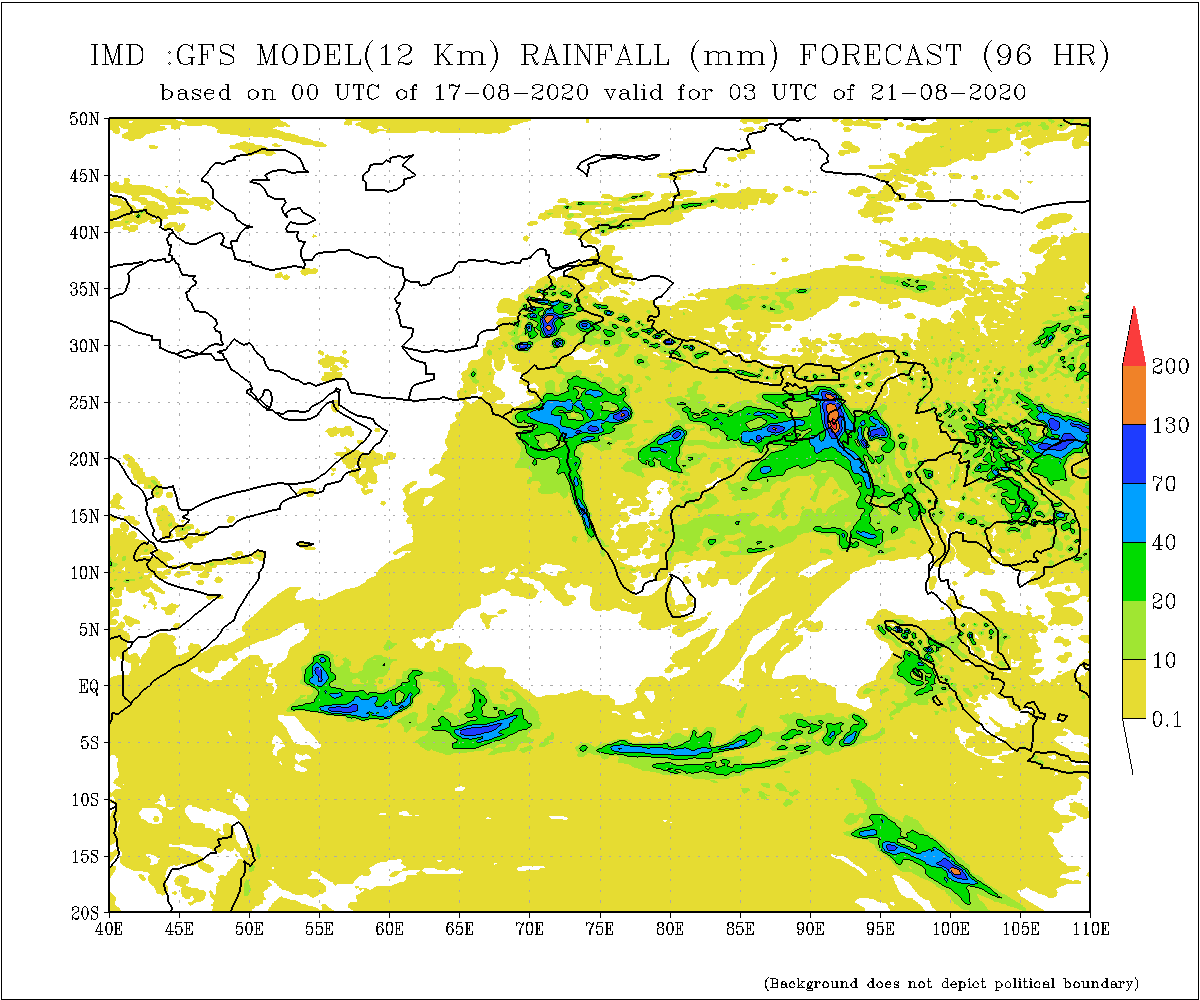
Total rainfall forecast from the IRI for next six days is provided in figures below. The figure to the left shows the expectancy of heavy rainfall events during these six days while the figure to the right is the prediction of total rainfall amount during this period.
psdef//plotaxislength/600/psdef//color_smoothing/null/psdef//antialias/true/psdef//plotbordertop/40/psdef//plotborderbottom/40/psdef//S/last/plotvalue/X/71.0/78.0/plotrange/Y/-2/10/plotrange//plotborder/72/psdef//XOVY/null/psdef//framelabelstart/(Forecast for %=[forecasttime] Issued %=[S])psdef//plotaxislength/600/psdef/+//S/last/plotvalue/X/79.0/83.0/plotrange/Y/5/10/plotrange+//plotaxislength+600+psdef//plotborder+72+psdef//XOVY+null+psdef+.gif) Extreme Rainfall Forecast |
+psdef//antialias+true+psdef//plotaxislength+550+psdef//XOVY+null+psdef//plotbordertop/40/psdef//plotborderbottom/40/psdef/+//S/last/plotvalue/X/71.0/78.0/plotrange/Y/-2/10/plotrange+//plotborder+72+psdef//XOVY+null+psdef//framelabelstart+(Forecast for %=[forecasttime] Issued %=[S])+psdef//plotaxislength+550+psdef/+//S/last/plotvalue/X/79.0/83.0/plotrange/Y/5/10/plotrange+//plotaxislength+550+psdef//plotborder+72+psdef//XOVY+null+psdef+.gif)  Total Six Day Precipitation Forecast |
The Outgoing Longwave Radiation (OLR) is a proxy for rainfall. This can be used to identify convective rain clouds based on the MJO phase. Violet and Blue shading indicates enhanced tropical weather and Orange shading indicates suppressed conditions. The following figure shows the forecasts of MJO associated anomolous OLR for the next 15 days from the Constructed Analogue (CA) model forecasts.
 |
Weekly Minimum and Maximum Temperature prediction from the GFS model (from NOAA CPC)
 |
 |
Weekly mean vector wind total prediction from the GFS model at 850 mb (left) and 700 mb (right) levels. (from NOAA CPC)
 |
 |
Following is the latest seasonal precipitation and temperature prediction for the next 3 months by the IRI. The color shading indicates the probability of the most dominant tercile -- that is, the tercile having the highest forecast probability. The color bar alongside the map defines these dominant tercile probability levels. The upper side of the color bar shows the colors used for increasingly strong probabilities when the dominant tercile is the above-normal tercile, while the lower side shows likewise for the below-normal tercile. The gray color indicates an enhanced probability for the near-normal tercile (nearly always limited to 40%).
psdef//plotaxislength/590/psdef//plotborderbottom/40/psdef//plotbordertop/40/psdef/+//L/1.0/plotvalue//F/last/plotvalue/X/65.0/89.0/plotrange/Y/-5/20/plotrange+//plotborder+72+psdef//XOVY+null+psdef//plotaxislength+800+psdef+.gif)  Precipitation Forecast |
psdef//plotaxislength/590/psdef//plotborderbottom/40/psdef//plotbordertop/40/psdef/+//L/1.0/plotvalue//F/last/plotvalue/X/65.0/89.0/plotrange/Y/-5/20/plotrange+//plotborder+72+psdef//XOVY+null+psdef//plotaxislength+800+psdef+.gif)  Temperature Forecast |
| Subscribe to our
Monthly Maldives Newsletter |
Follow @climatelk Contact Us email: fectsl@gmail.com phone: (+94) 81 2376746 blog: www.fectsl.blogspot.com |
Foundation for Environment,
Climate & Technology C/O Mahaweli Authority of Sri Lanka, Digana Village, Rajawella, SRI LANKA |
© 2016 Designed by Prabodha Agalawatte for Foundation for Environment Climate and Technology